Monitoring Your Installation

 Server v2.x Server Admin
 | CircleCI Server version 2.x is no longer a supported release. Please consult your account team for help in upgrading to a supported release. |
This section includes information on metrics for monitoring your CircleCI server v2.x installation.
Metrics Overview
Metrics are technical statistical data collected for monitoring and analytics purposes. The data includes basic information, such as CPU or memory usage, as well as more advanced counters, such as number of executed builds and internal errors. Using metrics you can:
-
Quickly detect incidents and abnormal behavior
-
Dynamically scale compute resources
-
Retroactively understand infrastructure-wide issues
How Metrics Work in CircleCI Server
Telegraf is the main component used for metrics collection in CircleCI server v2.x. Telegraf is server software that brokers metrics data emitted by CircleCI services to data monitoring platforms such as Datadog or AWS CloudWatch.
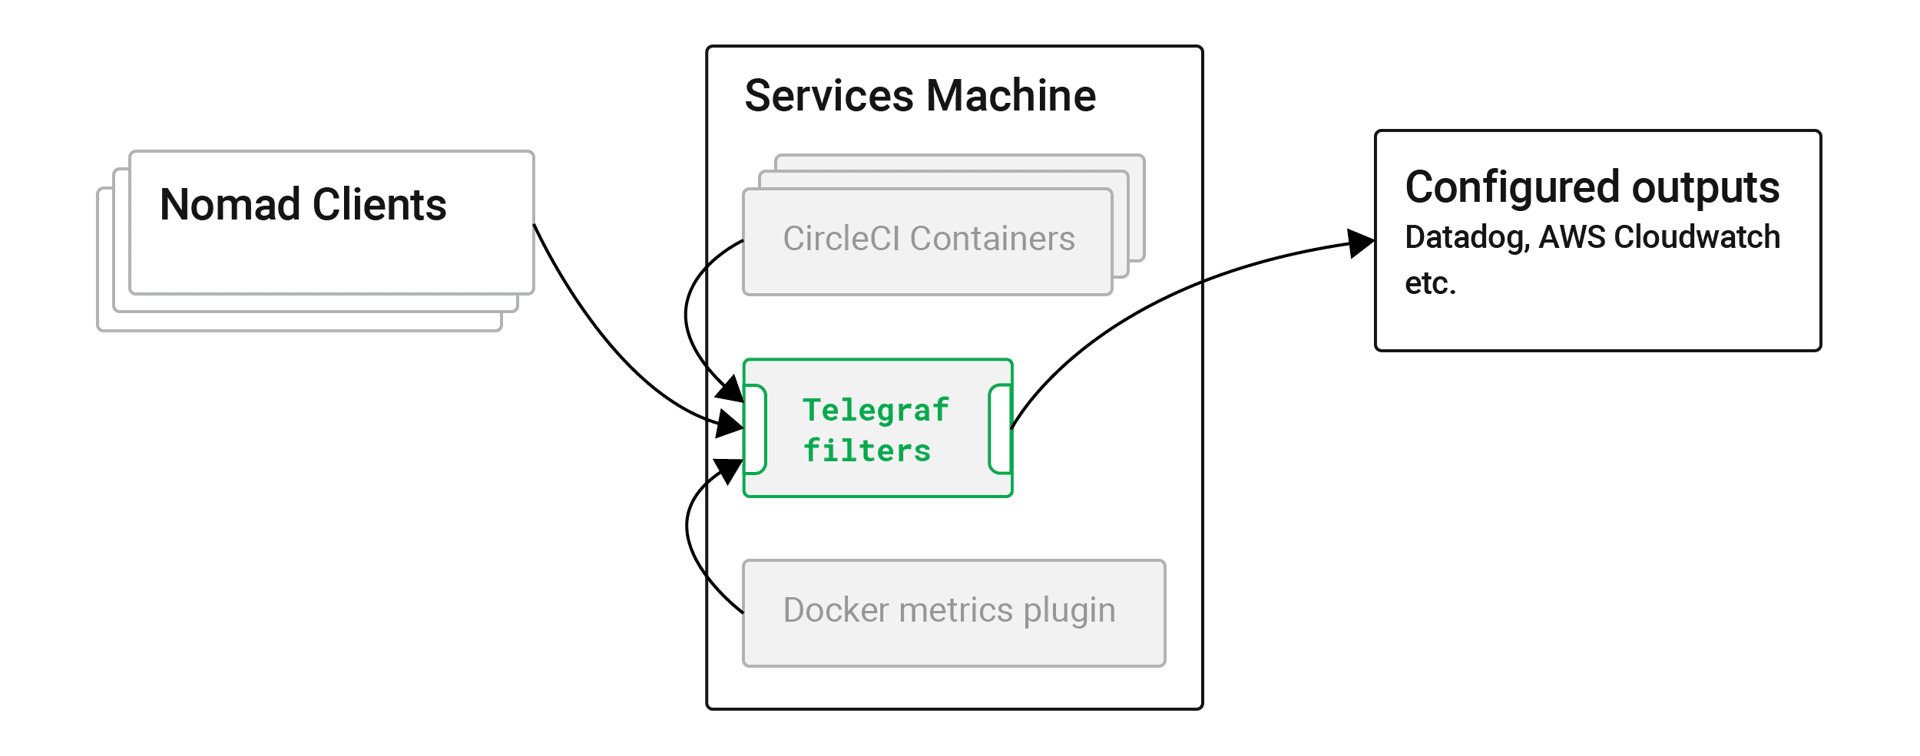
Metrics collection in CircleCI server v2.x works as follows:
-
Each component of a server installation sends metrics data to the telegraf container running on the Services machine.
-
Telegraf listens on port 8125/UDP and receives data from all components (inputs) and applies configured filters to determine whether data should be kept or dropped.
-
For some metric-types, Telegraf keeps metrics data inside and calculates statistical data (such as max, min, mean, stdev, sum) periodically.
-
Finally, Telegraf sends out data to configured sinks (outputs), such as stdout (on the Services machine), Datadog and/or AWS CloudWatch.
It is worth noting that Telegraf can accept multiple input and output types at the same time allowing administrators to configure a single Telegraf instance to collect and forward multiple metrics data sets to both Datadog and CloudWatch.
Standard Metrics Configuration
Review your metrics configuration file using the following command:
sudo docker inspect --format='{{range .Mounts}}{{println .Source "->" .Destination}}{{end}}' telegraf | grep telegraf.conf | awk '{ print $1 }' | xargs catThere are four notable blocks in the file (some blocks might not be there depending on your configuration in the Management Console):
-
[[inputs.statsd]]– Input configuration to receive metrics data through 8125/UDP (as discussed above) -
[[outputs.file]]– Output configuration to emit metrics to stdout. All accepted metrics are configured to be shown in Telegraf docker logs. This is helpful for debugging your metrics configuration. -
[[outputs.cloudwatch]]– Output configuration to emit metrics to CloudWatch -
[[outputs.datadog]]– Output configuration to emit metrics to Datadog
This configuration file is automatically generated by Replicated (the service used to manage and deploy CircleCI server v2.x) and is fully managed by Replicated. If you wish to customize the standard configuration you will need to configure Replicated to not insert the blocks you want to change.
Do not attempt to directly modify the file. Any changes made in this way will be destroyed by Replicated upon certain events, such as service restarts. For example, if a customized [[inputs.statsd]] block is added without stopping automatic interpolation, you will encounter errors as Telegraf attempts to listen to 8125/UDP twice, and the second attempt will fail with EADDRINUSE. |
In a standard configuration with no metrics customization the main config discussed above is all that is required. If you have configured metrics customization by placing files under /etc/circleconfig/telegraf, those configurations are appended to the main config – imagine `cat`ing the main config and all of those customization files. For more on customizing metrics see the Custom Metrics section.
System Monitoring Metrics
To enable metrics forwarding to either AWS Cloudwatch or Datadog, follow the steps for the service you wish to use in the Supported Platforms section. The following sections give an overview of available metrics for your installation.
VM Service and Docker Metrics
VM Service and Docker services metrics are forwarded via Telegraf, a plugin-driven server agent for collecting and reporting metrics.
The following metrics are enabled:
Nomad Job Metrics
Nomad job metrics are enabled and emitted by the Nomad Server agent. Five types of metrics are reported:
| Metric | Description |
|---|---|
| Returns 1 if the last poll of the Nomad agent failed, otherwise it returns 0. |
| Returns the total number of pending jobs across the cluster. |
| Returns the total number of running jobs across the cluster. |
| Returns the total number of complete jobs across the cluster. |
| Returns the total number of dead jobs across the cluster. |
When the Nomad metrics container is running normally, no output will be written to standard output or standard error. Failures will elicit a message to standard error.
CircleCI Metrics
Introduced in CircleCI server v2.18
| Tracks how many times an artifact has failed to upload. |
| Tracks how many builds flowing through the system are considered runnable. |
| Tracks how many 1.0 builds |
| Tracks how many api calls CircleCI is making to github |
| Tracks the response codes to CircleCi requests |
| Tracks nomad client metrics |
| Tracks how many nomad servers there are. |
| Tracks how long it takes for a runnable build to be accepted. |
| Keeps track of how many containers exist per builder ( 1.0 only ). |
| Tracks how many containers are available ( 1.0 only ) |
| Tracks how many containers are reserved/in use ( 1.0 only ). |
| Provides timing and counts for RabbitMQ messages processed by the |
| Tracks latency over the system grpc system calls. |
Supported Platforms
We have two built-in platforms for metrics and monitoring: AWS CloudWatch and DataDog. The sections below detail enabling and configuring each in turn.
AWS CloudWatch
To enable AWS CloudWatch complete the following:
-
Navigate to the settings page within your Management Console. You can use the following URL, substituting your CircleCI URL:
your-circleci-hostname.com:8800/settings#cloudwatch_metrics. -
Check Enabled under AWS CloudWatch Metrics to begin configuration.
 Figure 2. Enable Cloudwatch
AWS CloudWatch Configuration
There are two options for configuration:
-
Use the IAM Instance Profile of the services box and configure your custom region and namespace.
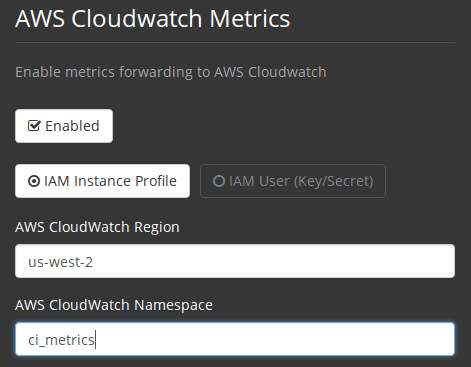 Figure 3. CloudWatch Region and Namespace
 -
Alternatively, you may use your AWS Access Key and Secret Key along with your custom region and namespace.
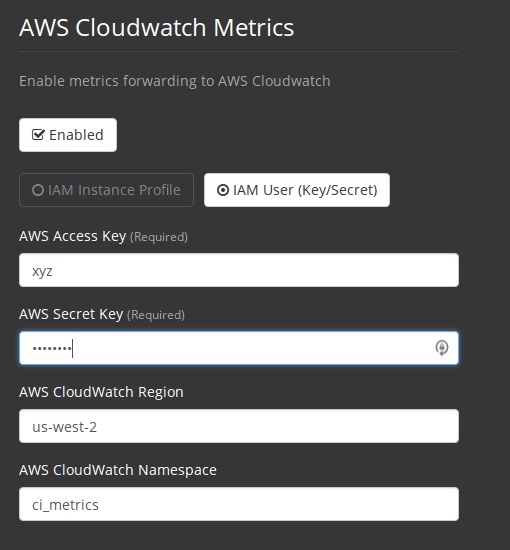 Figure 4. Access Key and Secret Key
After saving you can verify that metrics are forwarding by going to your AWS CloudWatch console.
DataDog
To enable Datadog complete the following:
-
Navigate your Management Console Settings. You can use the following URL, substituting your CircleCI hostname:
your-circleci-hostname.com:8800/settings#datadog_metrics -
Check Enabled under Datadog Metrics to begin configuration.
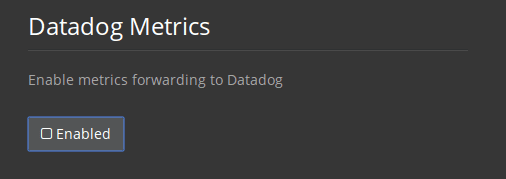 Figure 5. Enable Datadog Metrics
 -
Enter your DataDog API Key. You can verify that metrics are forwarding by going to your DataDog metrics summary.
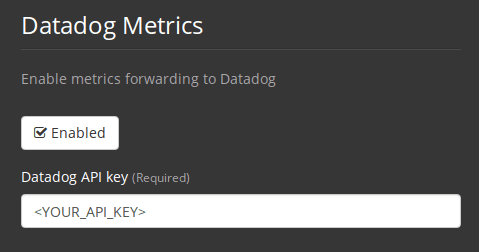 Figure 6. Enter Datadog API key
Custom Metrics
Custom Metrics using a Telegraf configuration file allows for more fine grained control than allowing Replicated to forward standard metrics to Datadog or AWS Cloudwatch.
The basic Server metrics configuration assumes fundamental use cases only. It might be beneficial to customize the way metrics are handled for your installation in the following ways:
-
Forward metrics data to your preferred platform (e.g. your own InfluxDB instance)
-
Monitor additional metrics in order to detect specific events
-
Reduce the number of metrics sent to data analysis platforms (to reduce gross operation costs)
1. Disable Standard Metrics Setup
-
Open the Management Console.
-
On the Settings page, go to Custom Metrics section and enable the "Use custom telegraf metrics" option.
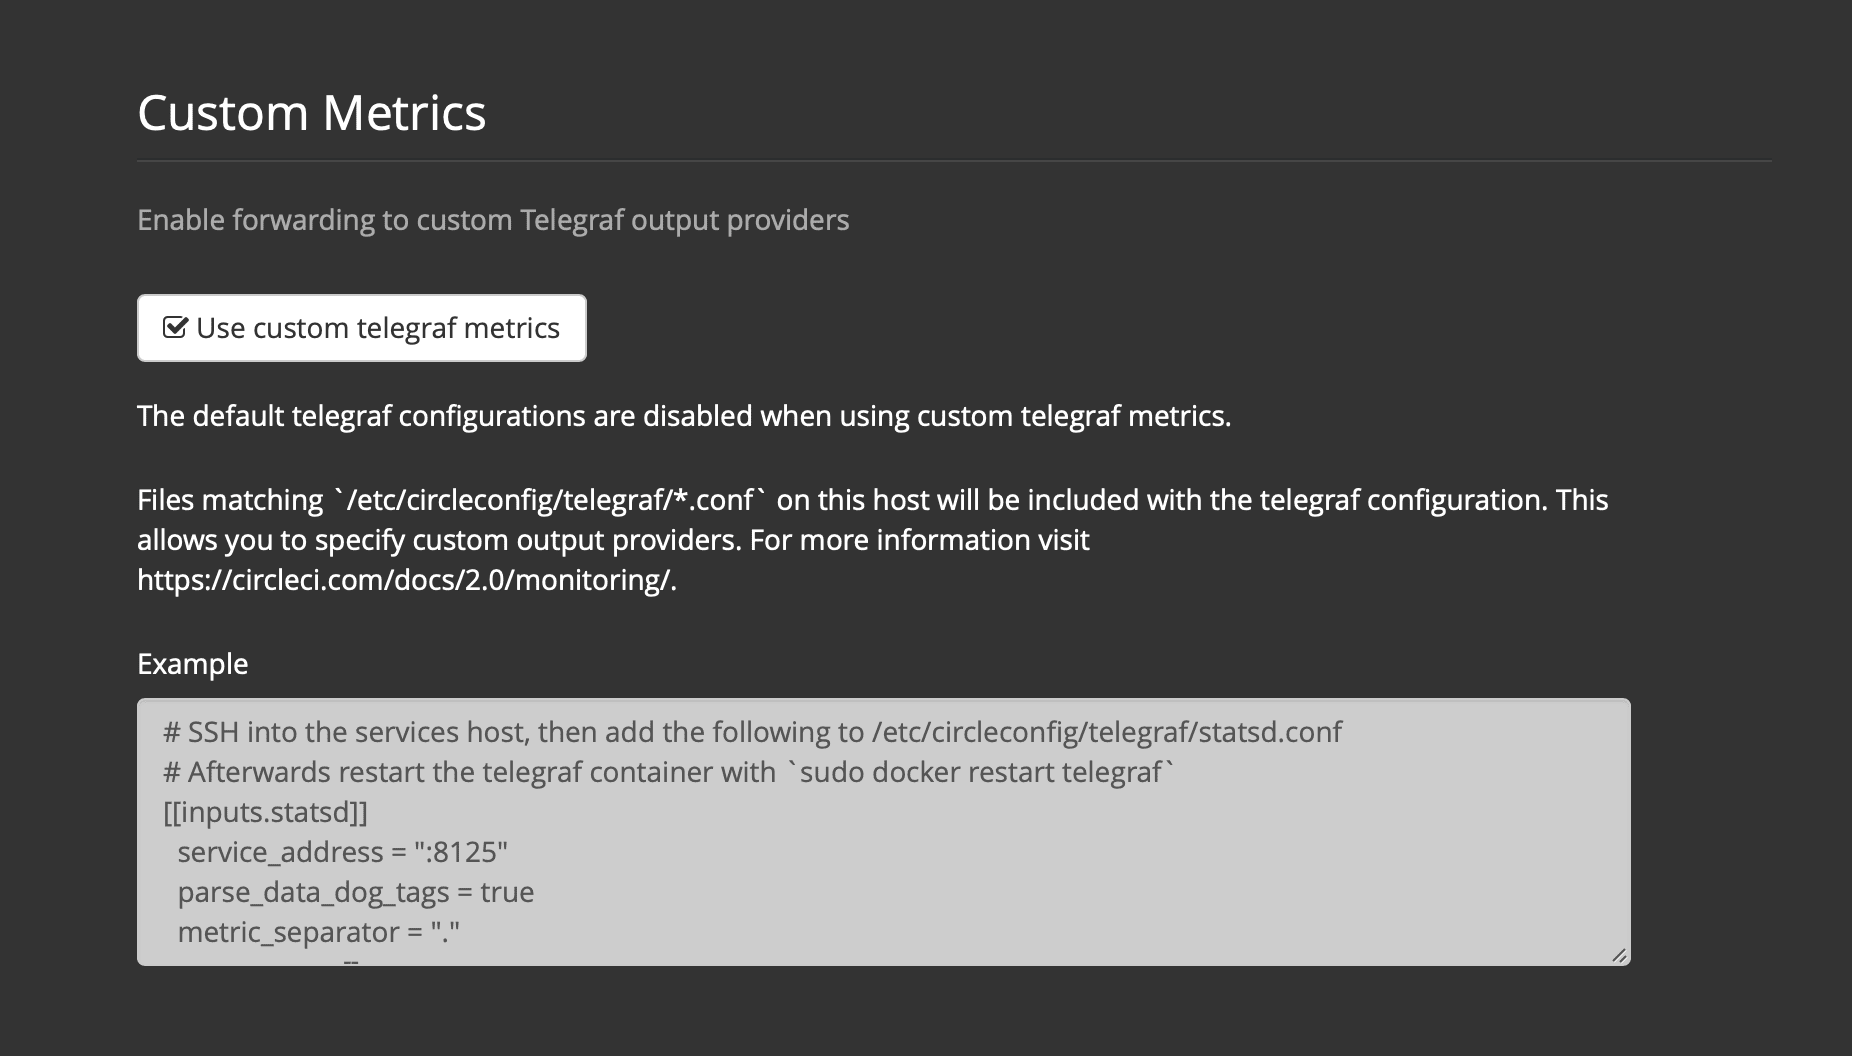 Figure 7. Custom Metrics
 -
Scroll down to save the change and restart services.
| There will be a downtime along with a service restart. After disabling it you will have to manually configure outputs to Datadog and/or CloudWatch, regardless of configurations on Replicated. |
2. Create your Customized Config
Now you are ready to do anything Telegraf supports! All you need to provide is a valid Telegraf config file.
-
SSH into the Services machine
-
Add the following to
/etc/circleconfig/telegraf/statsd.conf[[inputs.statsd]] service_address = ":8125" parse_data_dog_tags = true metric_separator = "." namepass = [] -
Under
namepassadd any metrics you wish to receive, the example below shows choosing to configure just the first 4 from the list above. (See below for some additional example configs):[[inputs.statsd]] service_address = ":8125" parse_data_dog_tags = true metric_separator = "." namepass = [ "circle.backend.action.upload-artifact-error", "circle.build-queue.runnable.builds", "circle.dispatcher.find-containers-failed", "circle.github.api_call" ] -
Restart the telegraf container by running:
sudo docker restart telegraf
| See the Telegraf README for further config syntax details. |
Sample Telegraph Configuration
Scenario 1: Record standard metrics to two InfluxDB instances
The example below records default metrics to two InfluxDB instances: One is your on-premises InfluxDB server (your-influx-db-instance.example.com), and the other is InfluxDB Cloud 2.
[[inputs.statsd]]
  service_address = ":8125"
  parse_data_dog_tags = true
  metric_separator = "."
  namepass = [
    "circle.backend.action.upload-artifact-error",
    "circle.build-queue.runnable.builds",
    "circle.dispatcher.find-containers-failed",
    "circle.github.api_call",
    "circle.http.request",
    "circle.nomad.client_agent.*",
    "circle.nomad.server_agent.*",
    "circle.run-queue.latency",
    "circle.state.container-builder-ratio",
    "circle.state.lxc-available",
    "circle.state.lxc-reserved",
    "circle.vm-service.vm.assigned-vm",
    "circle.vm-service.vms.delete.status",
    "circle.vm-service.vms.get.status",
    "circle.vm-service.vms.post.status",
    "circleci.cron-service.messaging.handle-message",
    "circleci.grpc-response"
  ]

[[outputs.influxdb]]
  url = "http://your-influx-db-instance.example.com:8086"
  database = "circleci"

[[outputs.influxdb_v2]]
  urls = ["https://us-central1-1.gcp.cloud2.influxdata.com"]
  token = "YOUR_TOKEN_HERE"
  organization = "circle@example.com"
  bucket = "circleci"
Scenario 2: Record all metrics to Datadog
The standard configuration handles only selected metrics, and there are many metrics discarded by Telegraf. If you want to receive this discarded, sophisticated data, such as JVM stats and per-container CPU usage, you can keep all received metrics by removing namepass filter. This example also illustrates how to configure metrics emission to Datadog. As discussed above, you need manual configuration for outputs to Datadog regardless of configurations on Replicated.
| This scenario leads to very large amounts of data. |
[[inputs.statsd]]
  service_address = ":8125"
  parse_data_dog_tags = true
  metric_separator = "."

[[outputs.datadog]]
  apikey = 'YOUR_API_KEY_HERE'
Scenario 3: Send limited metrics to CloudWatch
AWS charges fees for CloudWatch per series of scalar (i.e. at the level of "mean" or "sum"). Since multiple fields (e.g. mean, max, min and sum) are calculated for each metrics key (e.g. circle.run-queue.latency) and some fields can be redundant, you might want to select which fields are sent to CloudWatch. This can be achieved by configuring [[outputs.cloudwatch]] with fieldpass. You also may declare [[outputs.cloudwatch]] multiple times to pick up multiple metrics, as illustrated below.
[[inputs.statsd]]
  # Accept all metrics at input level to 1) enable output configurations without thinking of inputs, and to 2) dump discarded metrics to stdout just in case.
  service_address = ":8125"
  parse_data_dog_tags = true
  metric_separator = "."

[[outputs.cloudwatch]]
    # Fill in these two variables if you need to access CloudWatch with an IAM User, not an IAM Role attached to your Services box
    # access_key = 'ACCESS'
    # secret_key = 'SECRET'

    # Specify region for CloudWatch
    region = 'ap-northeast-1'
    # Specify namespace for easier monitoring
    namespace = 'my-circleci-server'

    # Name of metrics key to record
    namepass = ['circle.run-queue.latency']
    # Name of metrics field to record; key and field are delimited by an underscore (_)
    fieldpass = ['mean']

[[outputs.cloudwatch]]
    # Outputs can be specified multiple times.

    # Fill in these two variables if you need to access CloudWatch with an IAM User, not an IAM Role attached to your Services box
    # access_key = 'ACCESS'
    # secret_key = 'SECRET'

    # Specify region for CloudWatch
    region = 'ap-northeast-1'
    # Specify namespace for easier monitoring
    namespace = 'my-circleci-server'

    # Name of metrics key to record
    namepass = ['mem']
    # Name of metrics field to record; key and field are delimited by an underscore (_)
    fieldpass = ['available_percent']
Additional Tips
You may check the logs by running docker logs -f telegraf to confirm your output provider (e.g. influx) is listed in the configured outputs. Additionally, if you would like to ensure that all metrics in an installation are tagged against an environment you could place the following code in your config:
[global_tags]
Env="<staging-circleci>"
Please see the InfluxDB documentation for default and advanced installation steps.
| Any changes to the config will require a restart of the CircleCI application which will require downtime. |
Help make this document better
This guide, as well as the rest of our docs, are open source and available on GitHub. We welcome your contributions.
- Suggest an edit to this page (please read the contributing guide first).
- To report a problem in the documentation, or to submit feedback and comments, please open an issue on GitHub.
- CircleCI is always seeking ways to improve your experience with our platform. If you would like to share feedback, please join our research community.
Need support?
Our support engineers are available to help with service issues, billing, or account related questions, and can help troubleshoot build configurations. Contact our support engineers by opening a ticket.
You can also visit our support site to find support articles, community forums, and training resources.

CircleCI Documentation by CircleCI is licensed under a Creative Commons Attribution-NonCommercial-ShareAlike 4.0 International License.


