Using Insights

 Cloud Server v3.x Server v2.x
 Overview
The CircleCI Insights dashboard provides an overview of the health and usage of your repository build processes, allowing users to make better engineering decisions. Insights provides time-series data overviews of credit usage, success rates, pipeline duration, and other pertinent information.
This document describes how to access and use the Insights dashboard on CircleCI Cloud and Server.
Usage
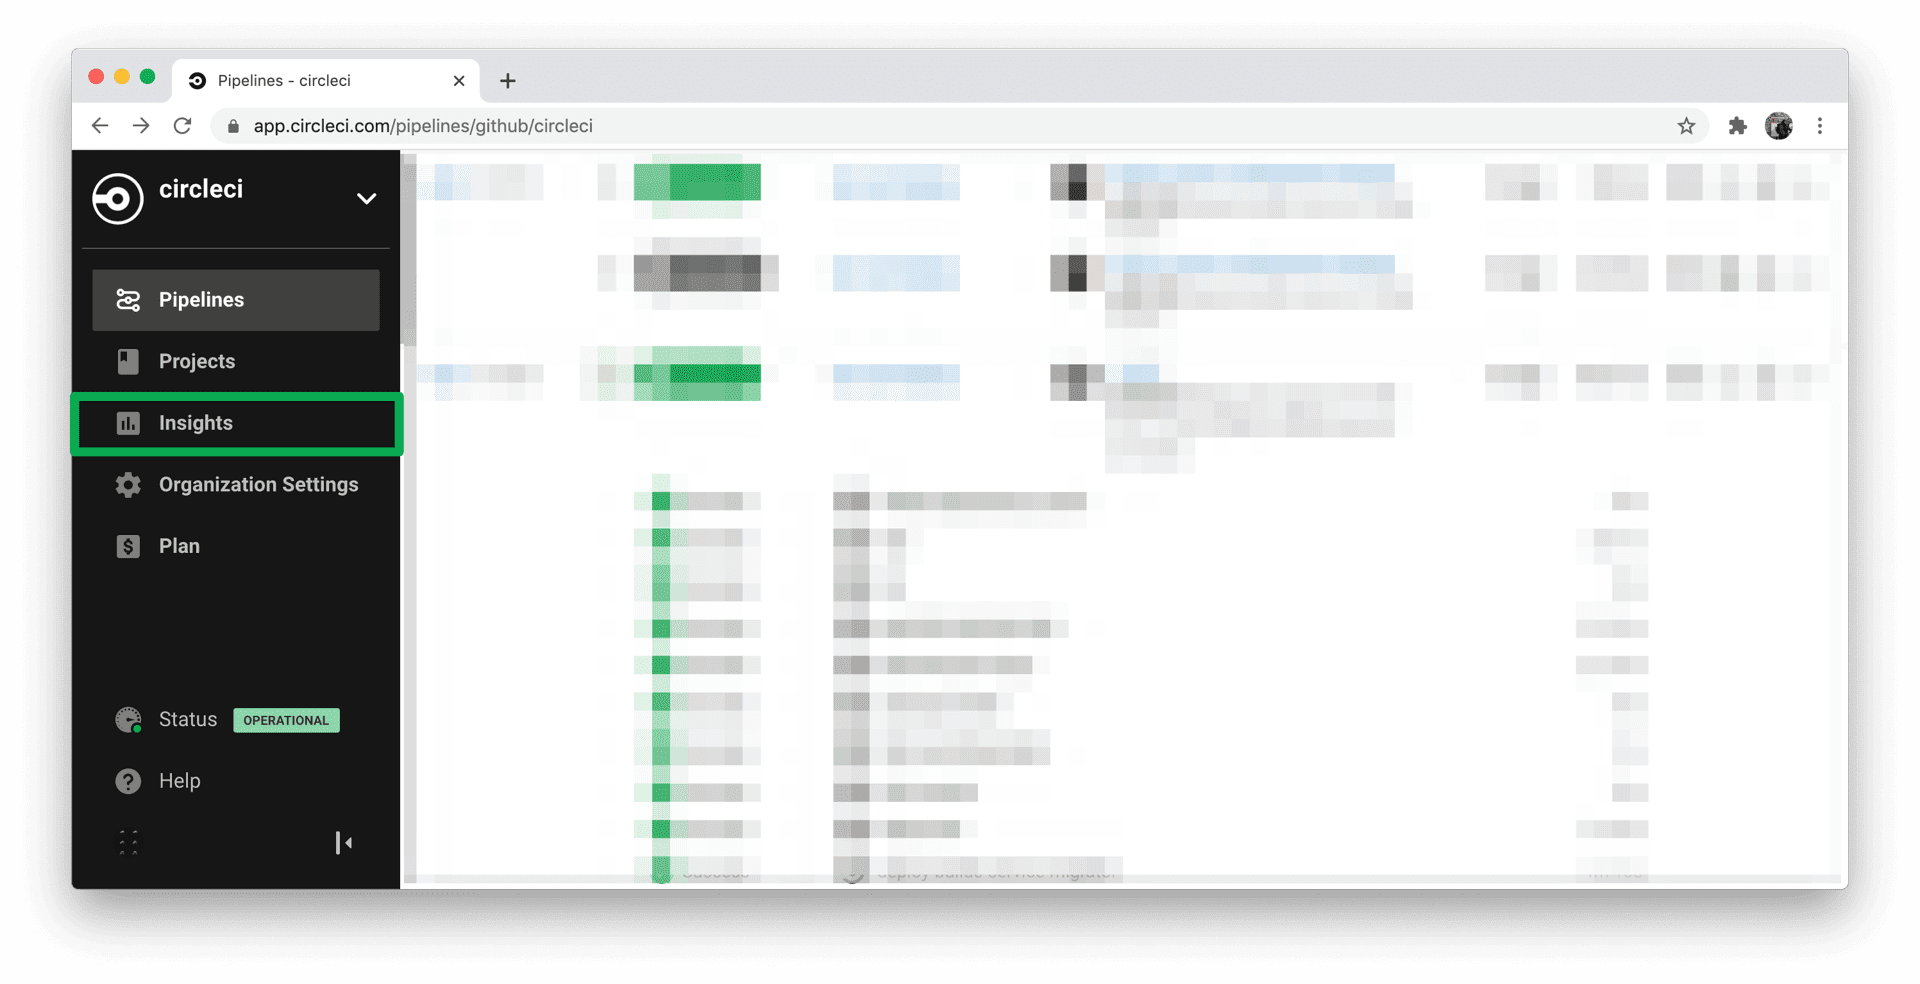
Insights across your organization can be accessed from the sidebar of the CircleCI web application.
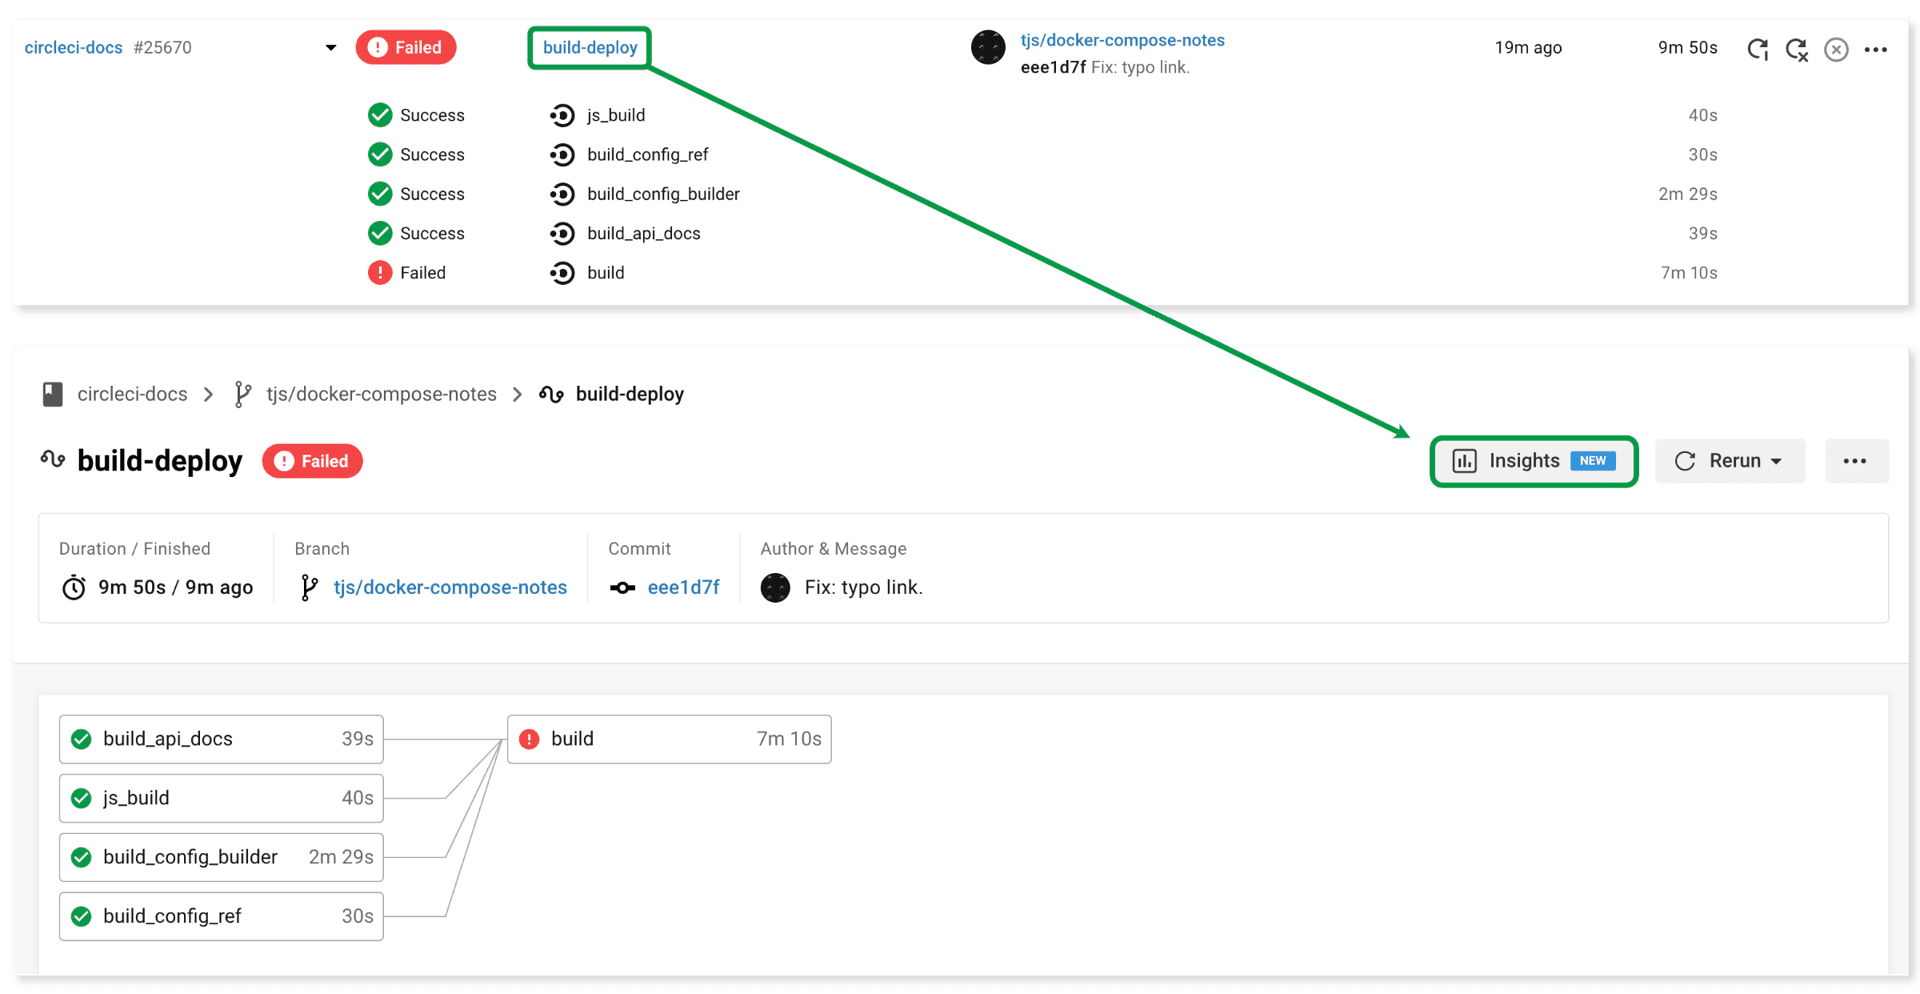
To access a specific project’s insights, view a pipeline’s workflow and click the Insights button. Alternatively, you may access the Insights page by clicking on the actions button while viewing the pipelines dashboard.


Workflow overview
The Insights dashboard provides workflow details plotted over time. Please note that the data is not real time and there may be up to a 24 hour delay. You may also filter by different workflows at the top of the page. The following data is charted under the workflow overview:
- All workflow runs
- Workflow success rate
- Workflow duration
- Workflow credit usage*
Job overview
Switch to the Job tab to view cumulative time-series data on a per-job basis:
- Total credits used*
- Duration (the 95th percentile)
- Total runs
- Success rate
* The Insights dashboard is not a real time financial reporting tool and should not be used for credit reporting. The most up to date credit information can be found in your organization’s Plan Overview.
CircleCI Server v2.19.x Insights
⚠️ Heads up! The following section refers to using the Insights page on installations of CircleCI Server v2.19.x.
Overview
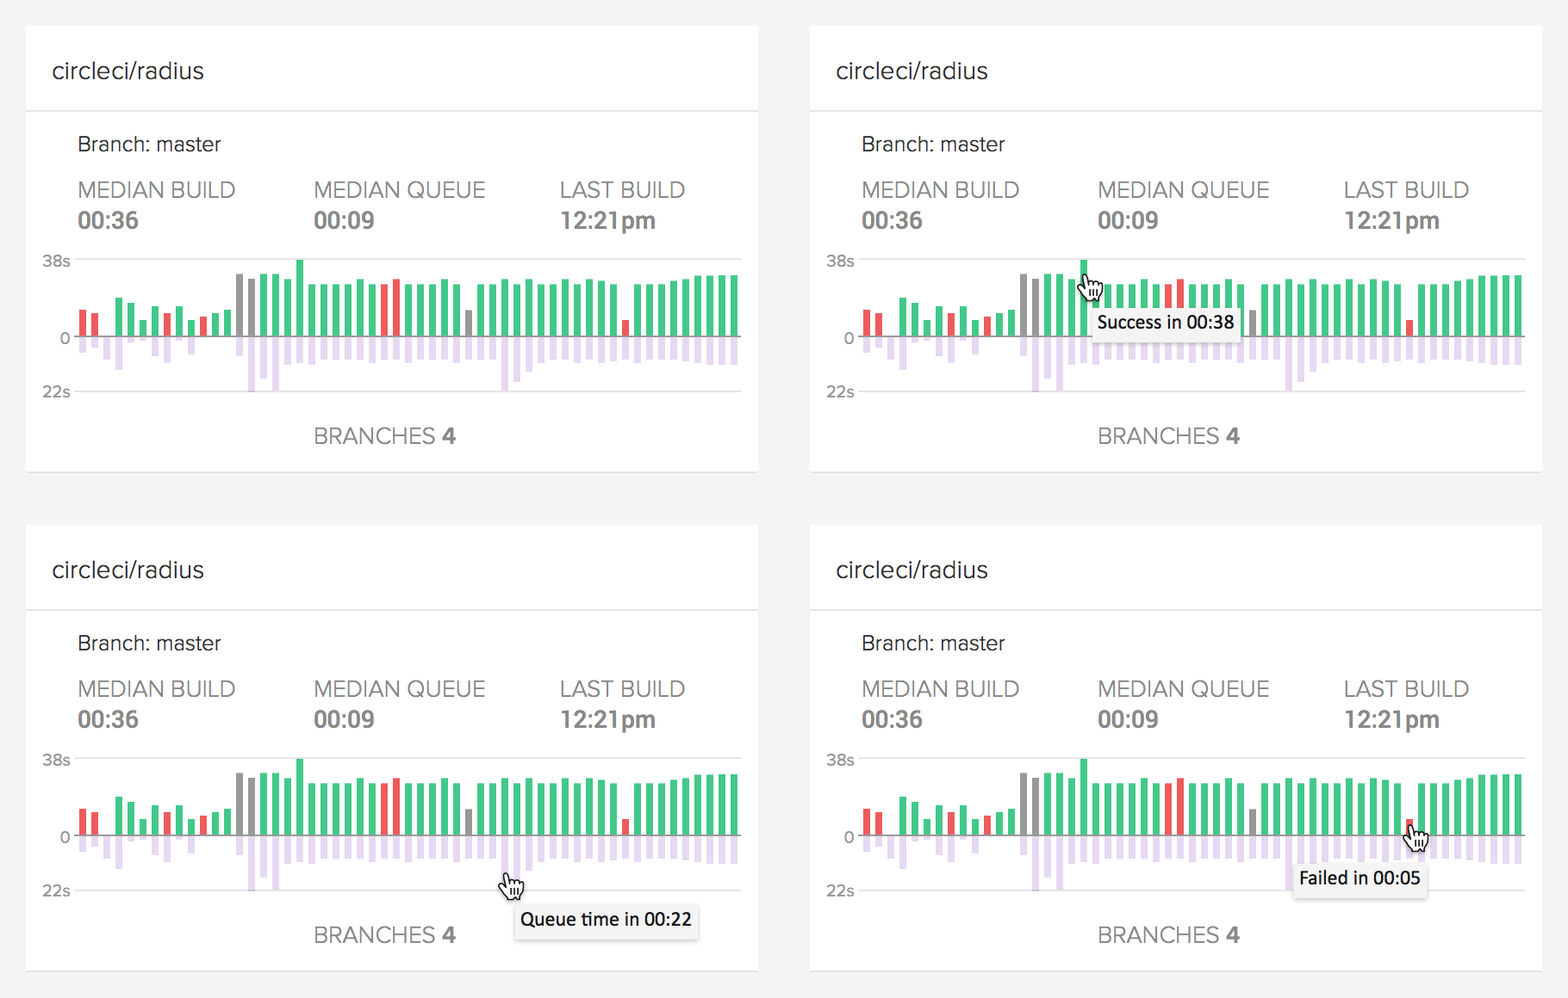
Click the Insights menu item in the CircleCI app to view a dashboard showing the health of all repositories you are following. Median build time, median queue time, last build time, success rate, and parallelism appear for your default branch. Note: If you have configured Workflows, graphs display all of the jobs that are being executed for your default branch.

The image illustrates the following data about your builds:
- Status of all your repos building on CircleCI in real time
- Median queue time
- Median build time
- Number of branches
- Last build
Project insights
Click the Insights icon on the main navigation, then click your repo name to access per-project insights.
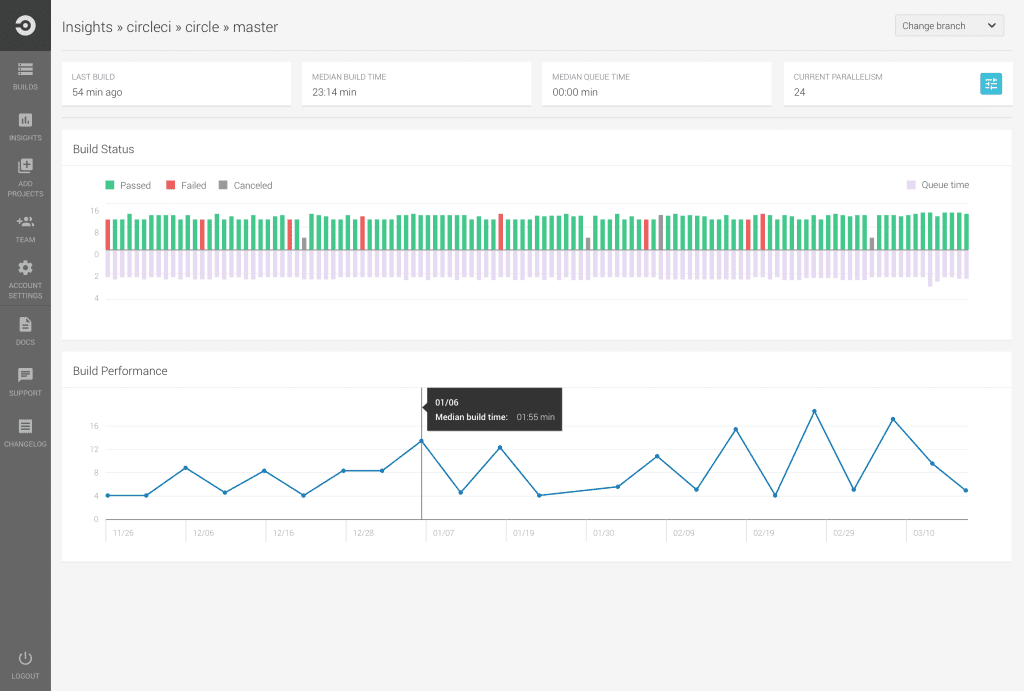
The per-project insights page gives you access to the build status and build performance graphs for a selected branch.

-
Build Status: The Insights dashboard shows the last 50 builds for your default branch. Click a branch in the top right corner to access over 100 build/job statuses for the selected branch.
-
Build Performance: The Build Performance graph aggregates your build/job data for a particular day and plots the median for that day going back as far as 90 days. Monitor the performance of your repo by clicking a particular branch.
See also
Refer to the Collecting Test Metadata document for instructions to configure insights into your most failed tests.
Learn More
Take the insights course with CircleCI Academy to learn more.
Help make this document better
This guide, as well as the rest of our docs, are open source and available on GitHub. We welcome your contributions.
- Suggest an edit to this page (please read the contributing guide first).
- To report a problem in the documentation, or to submit feedback and comments, please open an issue on GitHub.
- CircleCI is always seeking ways to improve your experience with our platform. If you would like to share feedback, please join our research community.
Need support?
Our support engineers are available to help with service issues, billing, or account related questions, and can help troubleshoot build configurations. Contact our support engineers by opening a ticket.
You can also visit our support site to find support articles, community forums, and training resources.

CircleCI Documentation by CircleCI is licensed under a Creative Commons Attribution-NonCommercial-ShareAlike 4.0 International License.


